How to fix a poor INP score: a step-by-step guide for business websites
Why your site fails Interaction to Next Paint, how to find the slow tap in Search Console and Chrome, and the fixes that move INP under 200 ms on WordPress, Webflow and custom sites.

- Published
- Reading time
- 7 min
TL;DR · Key takeaways
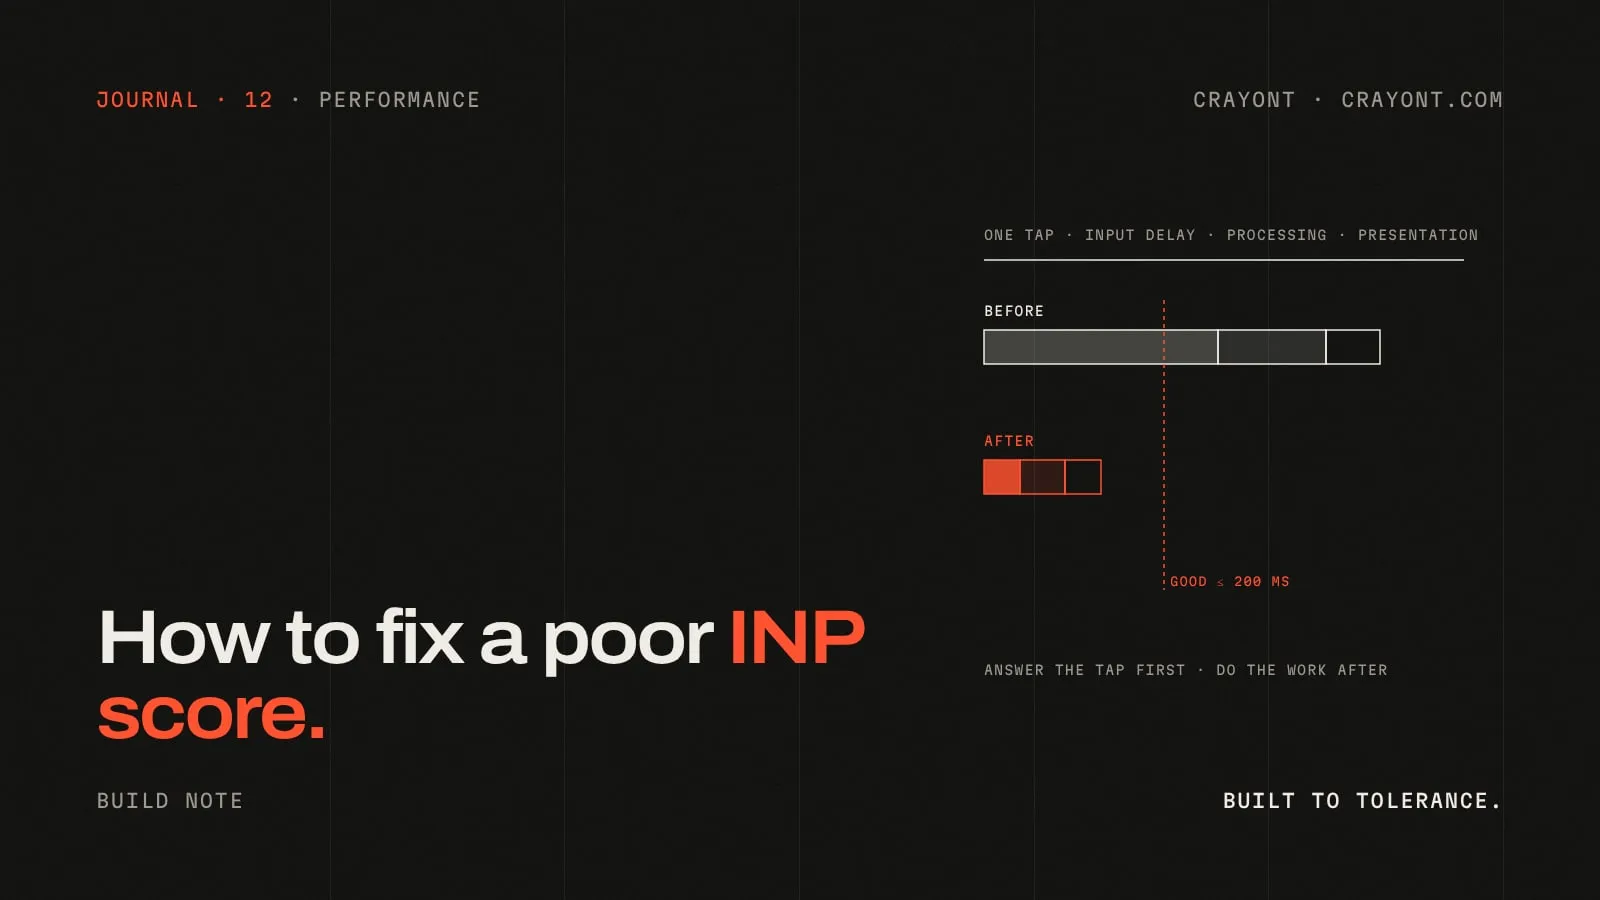
- INP measures how long the page takes to show a response after a tap, click or key press. Good is 200 ms or less at the 75th percentile of real visits; poor is over 500 ms.
- Every slow interaction has three parts: input delay (the main thread was busy), processing (your event handlers) and presentation (rendering the result). Find which part is long before you fix anything.
- On most business sites the cause is too much JavaScript: chat widgets, tag managers, page-builder scripts and big framework bundles. Removing or delaying them fixes more INP than any clever code.
- Show feedback first, do the heavy work after. Paint the pressed state, open the menu, then run the tracking and the data work in a later task.
You open Search Console and see it: INP issue: longer than 200 ms (mobile). Your pages load fine. Your Lighthouse score looks fine. So what’s slow?
INP, Interaction to Next Paint, doesn’t measure loading. It measures what happens after someone taps. They tap the menu, the “Book now” button, a tab, the cookie banner or the search field, and INP times how long the screen takes to show a response. It replaced First Input Delay as a Core Web Vital in March 2024. It’s harder to pass, because it looks at the interactions across the whole visit, not just the first one.
This guide is for people who own or run a business site and need the warning gone. You don’t need to be a developer to follow the diagnosis. The fixes at the end say which ones you can do yourself and which need a developer.
The thresholds
| INP at the 75th percentile | Rating |
|---|---|
| 200 ms or less | Good |
| 200–500 ms | Needs improvement |
| Over 500 ms | Poor |
The “75th percentile” means three out of four real visits must be at or under the number. One fast test on your own laptop proves nothing; INP is about your visitors’ phones.
What makes an interaction slow
Every interaction has three parts, and the fix depends on which one is long:
- Input delay. The tap happens, but the browser’s main thread is busy with something else: a script still loading, a tracking tag, an animation loop. The tap waits in a queue.
- Processing time. Your code’s event handlers run. If the click handler does a lot of work, such as filtering a big list, sending three analytics events or re-rendering a whole page component, this part is long.
- Presentation delay. After the code runs, the browser has to recalculate styles, lay out the page and paint the change. A huge page, or a change that forces the whole layout to recalculate, makes this long.
Most business sites fail on input delay. The page is busy running JavaScript the visitor never asked for, right when they try to use it.
Step 1: find out which pages fail
Open Google Search Console → Core Web Vitals → Mobile. Click the INP issue. Google groups similar URLs together, for example all your blog posts or all your service pages, and shows the INP for each group.
Write down the groups that fail. Usually it’s one template, not the whole site: product pages with a gallery, the homepage with a slider, or every page with a chat widget.
If your site doesn’t get enough traffic for Search Console data, open PageSpeed Insights and test the URL. The top section shows field data from real Chrome users when Google has enough of it.
Step 2: find the slow interaction
Now find which tap is slow. Open the page in Chrome on a laptop, then:
- Open DevTools → Performance.
- Turn on CPU throttling (4× or 6× slowdown) to behave more like a mid-range phone.
- Look at the Live metrics view. It shows your INP as you click around.
- Click the things real visitors click: the menu button, accordions, tabs, “Add to cart”, form fields, the cookie banner’s accept button.
Any interaction over 200 ms is shown, with its input delay, processing and presentation split out. Record one with the Performance panel and you’ll see exactly which scripts were running during it.
Common results we find:
- The menu button waits behind a chat widget or a heatmap script that’s still starting up.
- The cookie banner’s “Accept” fires every tracking tag at once, in the same task as the click.
- Accordions and tabs built with a page builder re-render large parts of the page.
- Search and filter fields run on every keystroke with no debounce.
Step 3: fix it
Start at the top of this list. The first fixes are cheaper and more effective than the later ones.
Remove scripts you don’t need
Make a list of every third-party script on the page: chat widgets, heatmaps, A/B testing tools, social embeds, extra analytics, old marketing pixels. For each one, ask whether anyone looked at its data or used it in the last three months. If not, remove it.
This is the single most effective INP fix on most business sites, and it often needs no developer at all: most of these tools are added through a tag manager, a plugin or a site setting.
Delay what’s left
Scripts that must stay don’t have to start the moment the page loads:
- Chat widgets: load them after the visitor scrolls, or show a lightweight button that loads the real widget only when tapped.
- Analytics and pixels: load them after the page has finished loading, not in the head.
- Embeds (maps, videos, social posts): show a static image and load the real embed on tap.
Answer the tap first, do the work after
When someone taps, update the screen first: open the menu, show the pressed state, show a spinner. Then do everything else, such as sending tracking events, saving to storage or fetching data, in a later task. In modern browsers a developer can use scheduler.yield() (with a setTimeout fallback) to hand control back so the browser can paint before the rest runs.
This one change often halves processing time, because the visitor sees the response before your analytics code runs.
Break up long tasks
A “long task” is any piece of JavaScript that runs for more than 50 ms without a break. Big ones block every tap that lands during them. Developers can split them by yielding between chunks of work, moving heavy calculations into a Web Worker, or debouncing input handlers so a search field doesn’t recalculate on every keystroke.
Make the page lighter to render
If presentation delay is the long part:
- Reduce DOM size. Page builders often wrap each element in several layers of
divs. Thousands of elements make every change slower to lay out. - Use
content-visibility: autoon long sections below the fold so the browser skips rendering them until they’re near the screen. - Animate with CSS transforms and opacity, not properties like width, height or top that force a new layout.
- Avoid reading layout right after changing it in the same handler. This “layout thrashing” forces the browser to recalculate several times in one tap.
Ship less framework JavaScript
If the site is built with React or another framework, the whole page may be hydrated, made interactive, even though only a menu and a form need JavaScript. Islands architecture, as in Astro, ships JavaScript only for the interactive parts. We wrote about this in Astro vs Webflow vs WordPress.
Platform notes
WordPress. Start with the plugin list. Page builders, slider plugins, social-share plugins and “all-in-one” marketing plugins are the usual INP problems. Deactivate them one at a time on a staging copy and re-test the slow interaction. Asset-cleanup plugins can stop scripts from loading on pages that don’t need them.
Webflow. Webflow’s own JavaScript is fairly light. Problems usually come from custom code in the site or page settings, heavy Interactions on page load, and third-party embeds. Check custom code first.
Shopify and other hosted platforms. Apps inject scripts into every page. Remove apps you don’t use, because some leave their scripts behind until you delete them properly.
Custom builds. Profile first, then fix the slowest handler. Keep the visual response immediate and move non-urgent work out of the event handler.
Step 4: confirm the fix
Lab tests confirm that your change helped. Field data confirms that it helped real visitors. After you deploy:
- Re-test the slow interaction in DevTools with throttling on.
- In Search Console, open the INP issue and click Validate fix. Google monitors the pages for 28 days.
- Watch the trend in the Core Web Vitals report. Field data moves slowly because it’s a 28-day rolling window.
When to get help
If you’ve removed the obvious scripts and INP is still poor, the problem is usually in the theme, the framework or custom code, and that’s developer work. Our Core Web Vitals audit starts at ₹15,000. It measures your real-user data, finds the slow interactions and gives you a prioritised fix list your own developer can follow, or we can do the fixes. For a site that needs rebuilding anyway, see our website redesign service.
Our full pre-launch list for all three vitals is in the Core Web Vitals checklist. You can see sites we’ve built on our work page, and if you’d like us to look at yours, send us the URL.
Questions people ask
- What is a good INP score?
- 200 milliseconds or less, measured for real visitors at the 75th percentile. Between 200 and 500 ms needs improvement, and over 500 ms is poor. Google reports it separately for mobile and desktop, and mobile is almost always worse.
- Why is my INP good in Lighthouse but poor in Search Console?
- A standard Lighthouse test loads the page without tapping anything, so it can't measure INP; it shows Total Blocking Time as a hint instead. Search Console uses field data from real Chrome users on real phones, tapping real menus, often while the page is still loading. Trust the field data.
- Does INP affect SEO?
- INP is one of the three Core Web Vitals Google uses in its page experience signals. It won't outrank better content on its own, but a slow, laggy page loses visitors, and that costs you enquiries whether or not it costs you rankings.
- Can a WordPress site pass INP?
- Yes, but usually not by adding another plugin. The fix is almost always removing scripts: unused plugins, page-builder features, sliders, chat widgets and duplicate tracking tags. A lean theme with a few well-chosen plugins passes comfortably.
Keep reading
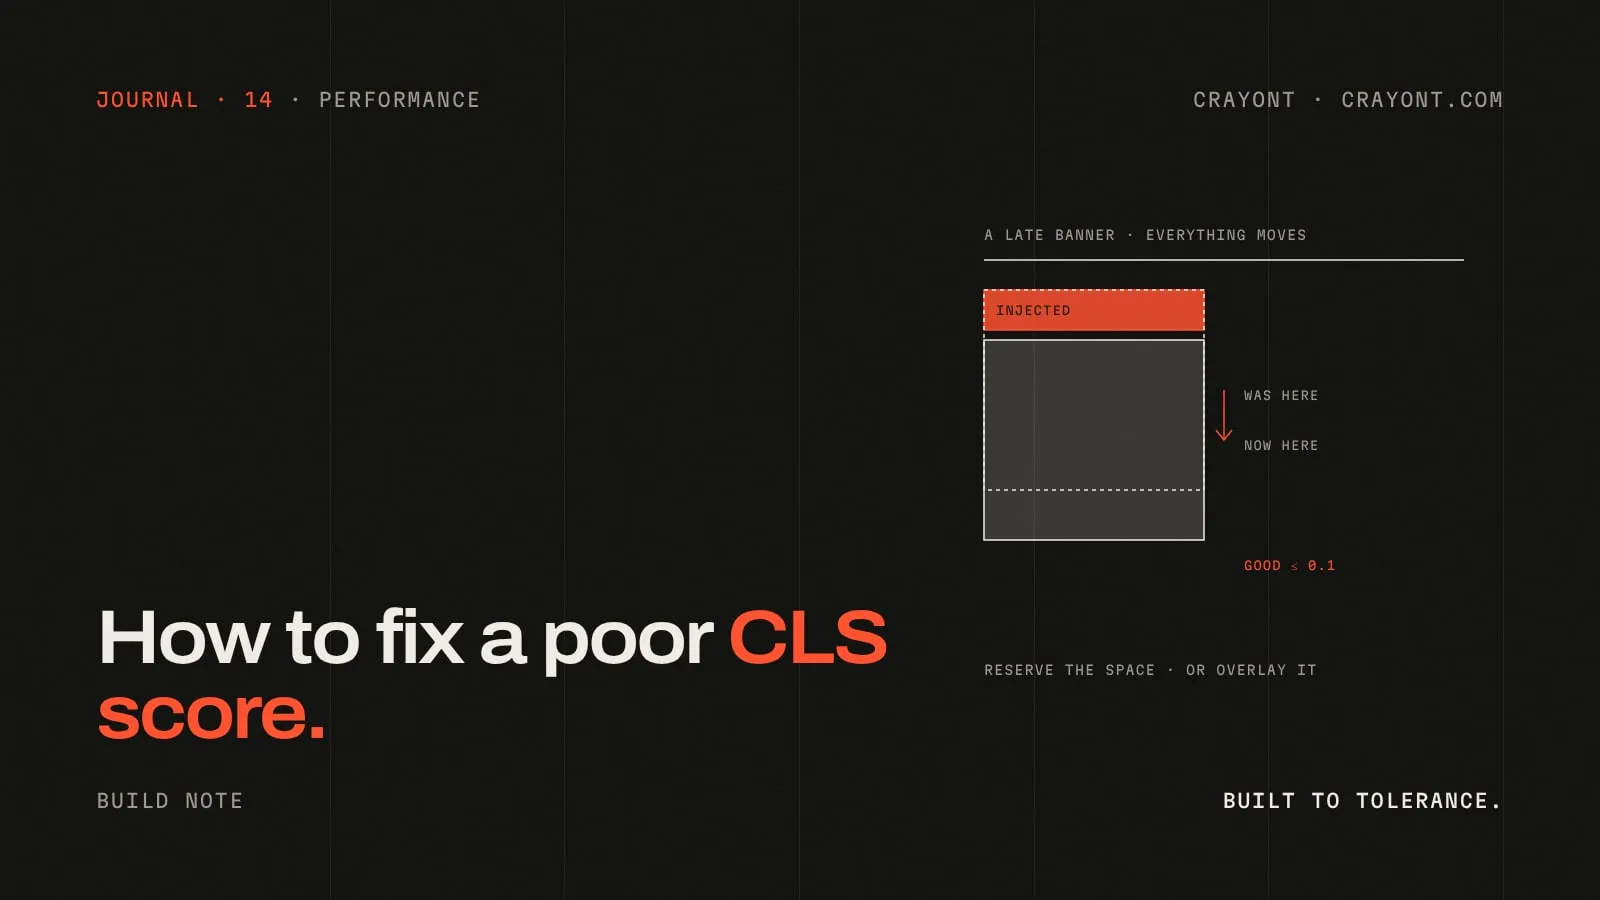
All notes →- How to fix a poor CLS score: stop your pages jumping aroundWhy your pages fail Cumulative Layout Shift, how to find the element that moves, and the fixes that bring CLS under 0.1 on WordPress, Webflow and custom sites.
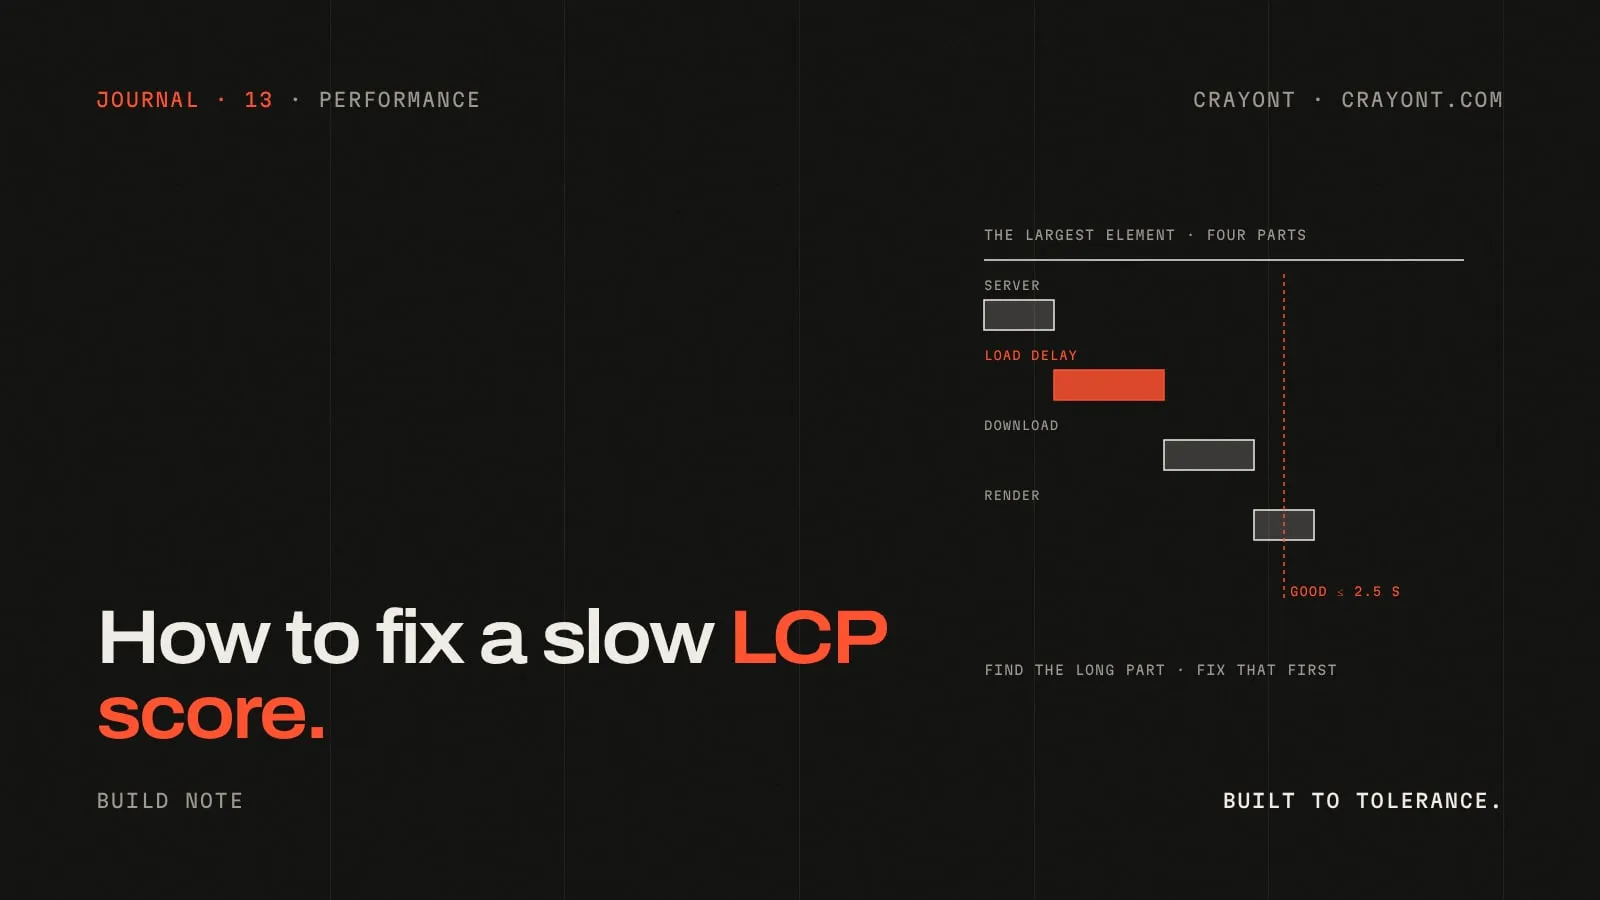
- How to fix a slow LCP score: a step-by-step guide for business websitesWhy your site fails Largest Contentful Paint, how to find the LCP element and which of its four parts is slow, and the fixes that bring LCP under 2.5 seconds on WordPress, Webflow and custom sites.
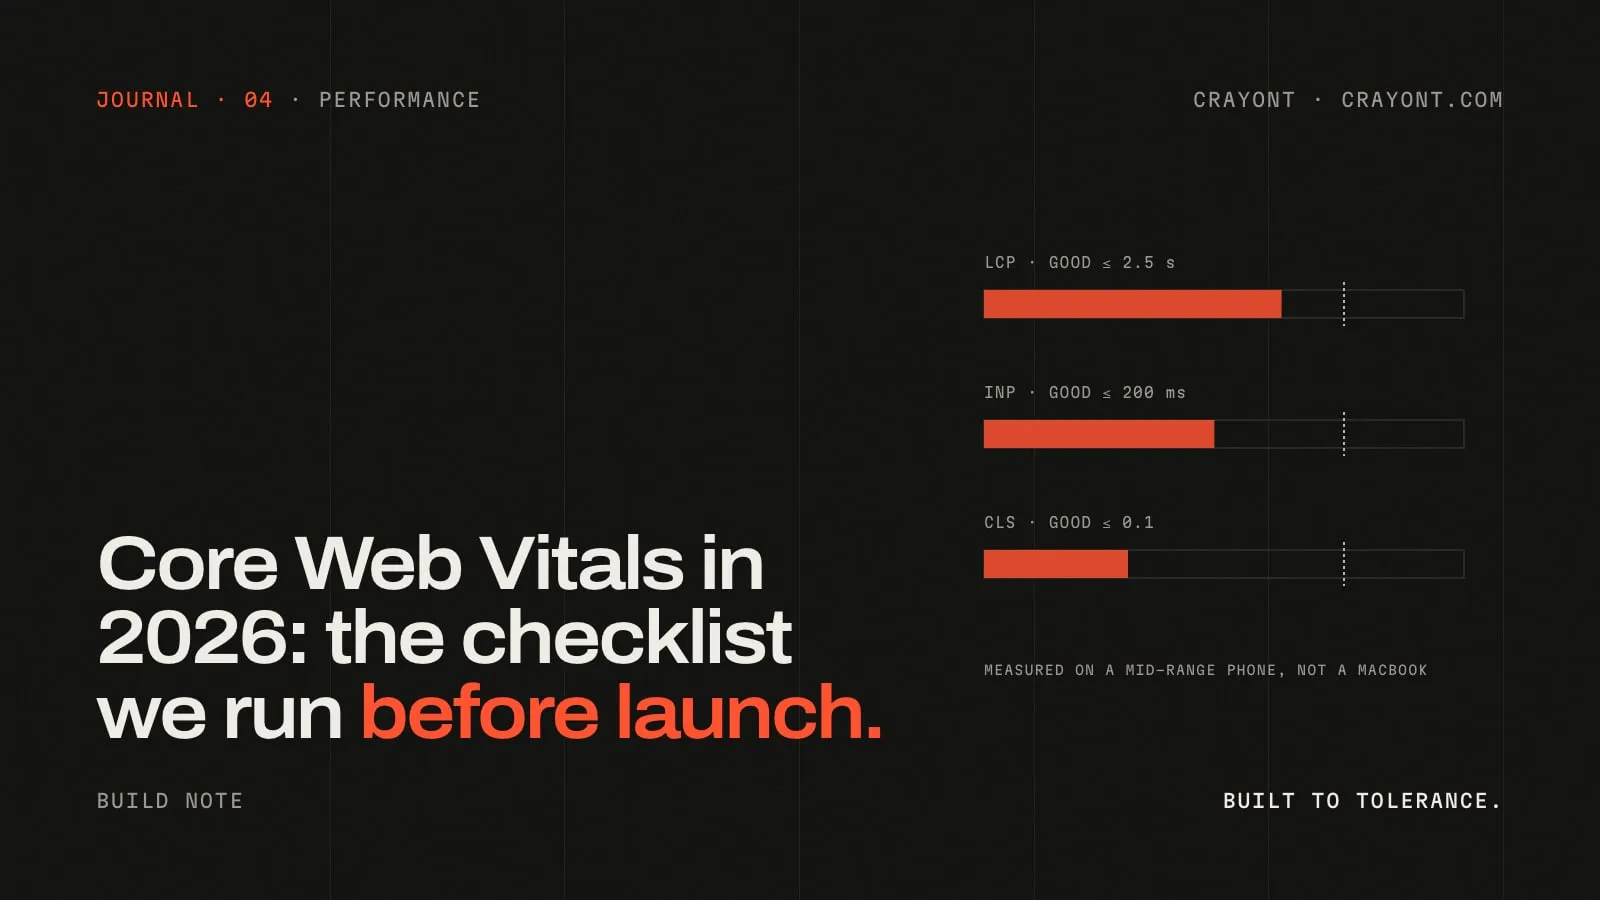
- Core Web Vitals in 2026: the checklist we run before every launchThe three Core Web Vitals (LCP, INP, CLS), their thresholds, why sites usually fail them, and the fix list we run on every site before it goes live.