Core Web Vitals in 2026: the checklist we run before every launch
The three Core Web Vitals Google measures (LCP, INP, CLS), their thresholds, the usual causes of failing them, and the fix list a development studio in Tamil Nadu runs on every site before it goes live.
TL;DR · Key takeaways
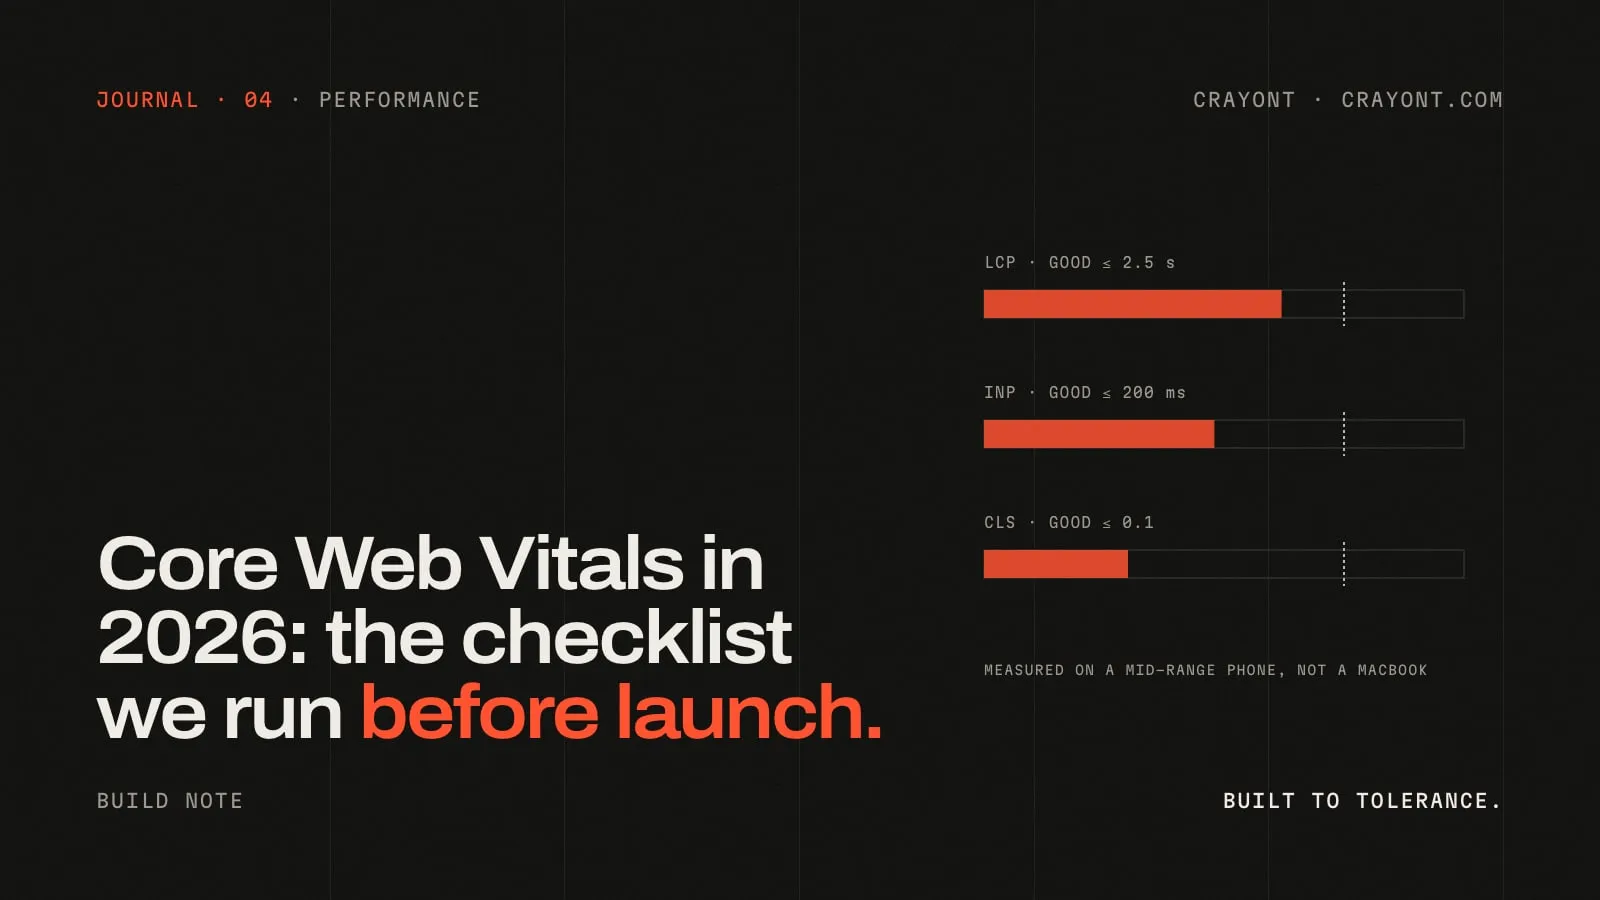
- Google's thresholds are public: LCP at or under 2.5 seconds, INP at or under 200 milliseconds, CLS at or under 0.1, measured for real visitors at the 75th percentile.
- LCP is usually the hero image or heading: preload it, size it, serve it as WebP or AVIF, and never load it through JavaScript.
- INP is usually JavaScript: third-party tags, heavy frameworks and long tasks. Ship less, defer the rest.
- CLS is usually fonts, images without dimensions and late-loading banners. Reserve space for everything and preload the fonts.
Core Web Vitals are the three numbers Google uses to describe how a page feels to a real visitor. They’re measured in the field, from actual Chrome users, and they’re part of how Google evaluates page experience. More importantly, they’re a decent proxy for whether people stay on your site.
This is the checklist we run on every build before launch. It’s written for anyone who owns a website, not only developers, so you can hand it to whoever builds yours.
The three metrics and their limits
| Metric | What it measures | Good | Needs work |
|---|---|---|---|
| LCP (Largest Contentful Paint) | How long until the biggest visible element has rendered | ≤ 2.5 s | > 4 s |
| INP (Interaction to Next Paint) | How long the page takes to respond to a tap or click | ≤ 200 ms | > 500 ms |
| CLS (Cumulative Layout Shift) | How much the layout jumps around while loading | ≤ 0.1 | > 0.25 |
Google judges a page on the 75th percentile of real visits, which means the slow phones on slow networks count more than your office Wi-Fi. That’s why we test on a mid-range Android phone on mobile data, and why our internal budgets are tighter than the official limits.
LCP: get the biggest thing on screen fast
The LCP element is almost always the hero image, a large heading or a video poster. The usual reasons it’s late:
- It’s loaded by JavaScript. Sliders, lazy-loading libraries and frameworks that render the hero on the client delay it by the whole script download. The LCP element must be in the HTML.
- It’s too heavy. A 3 MB PNG hero is common. Serve WebP or AVIF, sized for the viewport, with
srcset. - It isn’t prioritised. Add
fetchpriority="high"and apreloadfor the hero image; never lazy-load anything above the fold. - The server is slow. Time to first byte over about 800 ms eats most of the budget before the browser starts. Static hosting on a CDN fixes this for most business sites.
- Fonts block the text. If the heading is the LCP, a web font that arrives late delays it. Preload the display font and use
font-display: swapwith a fallback whose metrics match.
Our target: LCP under 2 seconds on a mid-range phone, with the poster or hero in the first response.
INP: respond to every tap quickly
INP replaced First Input Delay in 2024 and is harder to pass, because it measures every interaction, not just the first. The usual causes:
- Third-party scripts. Chat widgets, analytics bundles, tag managers loaded with a dozen tags, consent tools. Each one runs on the main thread. Audit them; remove the ones nobody uses; load the rest after the page is interactive.
- Heavy frameworks for static content. A marketing page doesn’t need a client-side app. Ship HTML, add interactivity only where it exists. (This is a big part of why we build on Astro.)
- Long tasks. Any script that runs for more than 50 ms blocks the next paint. Break work up, or move it off the main thread.
- Animation libraries on scroll. Effects that recalculate layout on every scroll event will show up here. Use transforms and opacity, batch reads and writes, and pause work that’s off screen.
Our target: INP under 150 ms, checked with real taps on a phone, not just a lab score.
CLS: nothing moves after it appears
Layout shift is the most annoying metric for visitors and the easiest to fix:
- Images without dimensions. Every
<img>needswidthandheight(or an aspect ratio) so the browser reserves space before it loads. - Fonts swapping. A fallback font with different metrics reflows the whole page when the web font arrives. Preload the fonts and use a metric-matched fallback.
- Late banners and embeds. Cookie bars, announcement strips and ad slots that push content down. Reserve their space or overlay them.
- Pinned and animated sections. Some scroll-pinning techniques toggle an element’s position and register as a full-screen shift. Prefer
position: stickyand animate with transforms.
Our target: CLS under 0.05, checked by scrolling the whole page with a layout-shift observer, not just at load.
The pre-launch run
This is the literal order we work in:
- Build the site and serve it exactly as production will.
- Run Lighthouse on mobile for every template (home, service, article, contact). Fix anything red.
- Scroll every page top to bottom with a script that records every layout shift and its source element. Fix every one above 0.01.
- Check the LCP element on each page is in the HTML, preloaded and under 200 KB.
- Open Chrome’s Performance panel on a throttled CPU and tap every interactive element. Anything over 150 ms gets fixed.
- Test on a real mid-range Android phone and an iPhone on mobile data.
- After launch, watch Search Console’s Core Web Vitals report for 28 days, because field data lags and always looks worse than the lab.
What to do if your site fails today
Start with the report in Google Search Console: it groups URLs by the metric they fail. Most sites fail one metric on one template, and fixing that template fixes hundreds of pages. If you’d rather hand it over, our performance and care service starts with exactly this audit and a prioritised fix list, with the before and after numbers in writing.
FAQ · Questions people ask
- Do Core Web Vitals affect rankings?
- Yes, as one signal among many. Google uses them in its page experience evaluation, and fast pages also convert better and get crawled more efficiently. They are not a substitute for good content, but they are a tie-breaker and a hygiene bar.
- Where do I see my site's real numbers?
- Google Search Console has a Core Web Vitals report built from real visitors (the Chrome User Experience Report). PageSpeed Insights shows both field data and a lab run for a single URL. Lighthouse in Chrome DevTools is lab only, useful for debugging, not for judging.
- What's a realistic target for a business site?
- Well inside the thresholds, not on the line: LCP under 2 seconds, INP under 150 milliseconds, CLS under 0.05 on a mid-range phone. Our own budgets are stricter than Google's because field numbers are always worse than lab numbers.